TCEX Platform Trading Board and Technical Chart User Manual
TCEX (Techcom Crypto Exchange) Board and Technical Chart User Guide
The Price Board is the core interface for investors to understand market dynamics, capture liquidity, and view order books.
I. Structure & Key Metrics
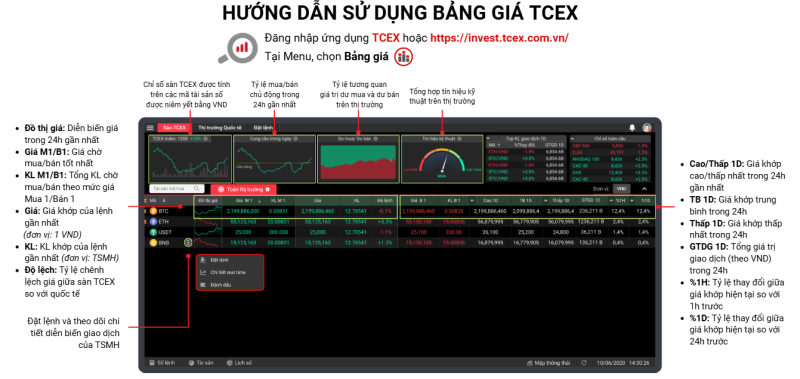
- Asset Codes & Trading Pairs: Displays crypto asset tickers (e.g., BTC/VND, ETH/VND, or USDT trading pairs), supporting quick filtering and favoriting.
- Reference Price & Price Changes (%):
- Green: Price has risen compared to the reference/previous opening price.
- Red: Price has fallen compared to the reference price.
- Yellow/Purple: Indicates flat price movement or reaching price fluctuation limits (depending on whether circuit breaker mechanisms apply to compliant trading pairs).
- Top 3 Bid/Ask Depth: Displays the most competitive Buy 1–3 (Price 1–3, Volume 1–3) and Sell 1–3 orders in real time, accurately reflecting order book depth.
- Matched Trades: Updates the price, volume, and price direction of the latest executed trade in real time.
- 24-Hour Statistics: Displays cumulative daily trading volume, highest price, and lowest price to evaluate the asset’s daily volatility and liquidity.
II. Useful Board Features
- Categorization & Filtering: Supports filtering by Top Caps, compliant pilot tokens, high-liquidity tokens, or direct Vietnamese Dong (VND) pairs.
- Watchlist: Allows developers and investors to customize and pin preferred tokens for efficient market monitoring.
III. In-Depth Technical Chart Analysis
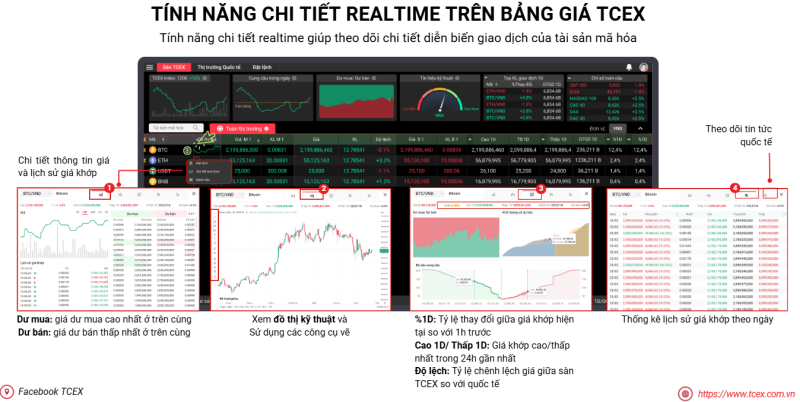
Vietnam crypto exchange TCEX integrates advanced technical analysis charting (typically powered by the TradingView engine) to provide professional support for quantitative and technical analysts.
1. Candlestick Chart Fundamentals
- Timeframe Selection: Covers 1m, 5m, 15m, 1H, 4H, 1D, 1W, etc., meeting the demands of both high-frequency scalping and medium-to-long-term swing trading.
- Candlestick Anatomy: Each candlestick clearly displays the Open, High, Low, and Close (OHLC) prices for the selected period.
2. Common Technical Indicators & Tools
- Trends & Moving Averages (MA/EMA/Bollinger Bands): Used to determine bullish or bearish trends and identify dynamic support and resistance levels.
- Momentum & Oscillators (RSI/MACD): Helps identify overbought or oversold conditions and spot divergence signals.
- Drawing & Pattern Tools: Offers trendlines, Fibonacci retracements, and other tools to mark key chart structures.
- Volume Analysis: Combines price and volume data to validate the strength of breakouts.
IV. Order Placement & Chart Integration
- Direct Chart Trading: Investors can invoke the trading panel directly below or alongside the technical chart, minimizing latency caused by switching screens.
- Order Types & Applications:
- Limit Orders: Preset buying or selling prices based on chart support/resistance levels to control execution costs.
- Market Orders: Execute instantly at the best available market price, ideal for capturing sudden breakout movements.
- Stop-Loss / Take-Profit Orders: Preset risk control levels to protect capital in a highly volatile crypto market.
V. Operational Recommendations Based on the Vietnamese Crypto Landscape
- Monitor VND Liquidity & Fiat Gateways: Prioritize direct VND-denominated trading pairs, pay close attention to real-time bid-ask spreads, and place orders during peak liquidity hours.
- Prioritize Risk Management & Compliance: Crypto assets are highly volatile. Use technical indicators like ATR or Bollinger Bands to set reasonable stop-loss levels and avoid chasing market highs.
- Security & Identity Verification: Ensure full KYC verification and enable Two-Factor Authentication (2FA) on TCEX before trading to secure your account and assets.